

Benchmarking and Paying for General Fund Services in a Hub Community
The following analysis by Brattleboro Town Manager John Potter was presented to Selectboard during a regular meeting held on Feb. 17, 2026. Watch the presentation here. Read the full memo here, which includes raw data.
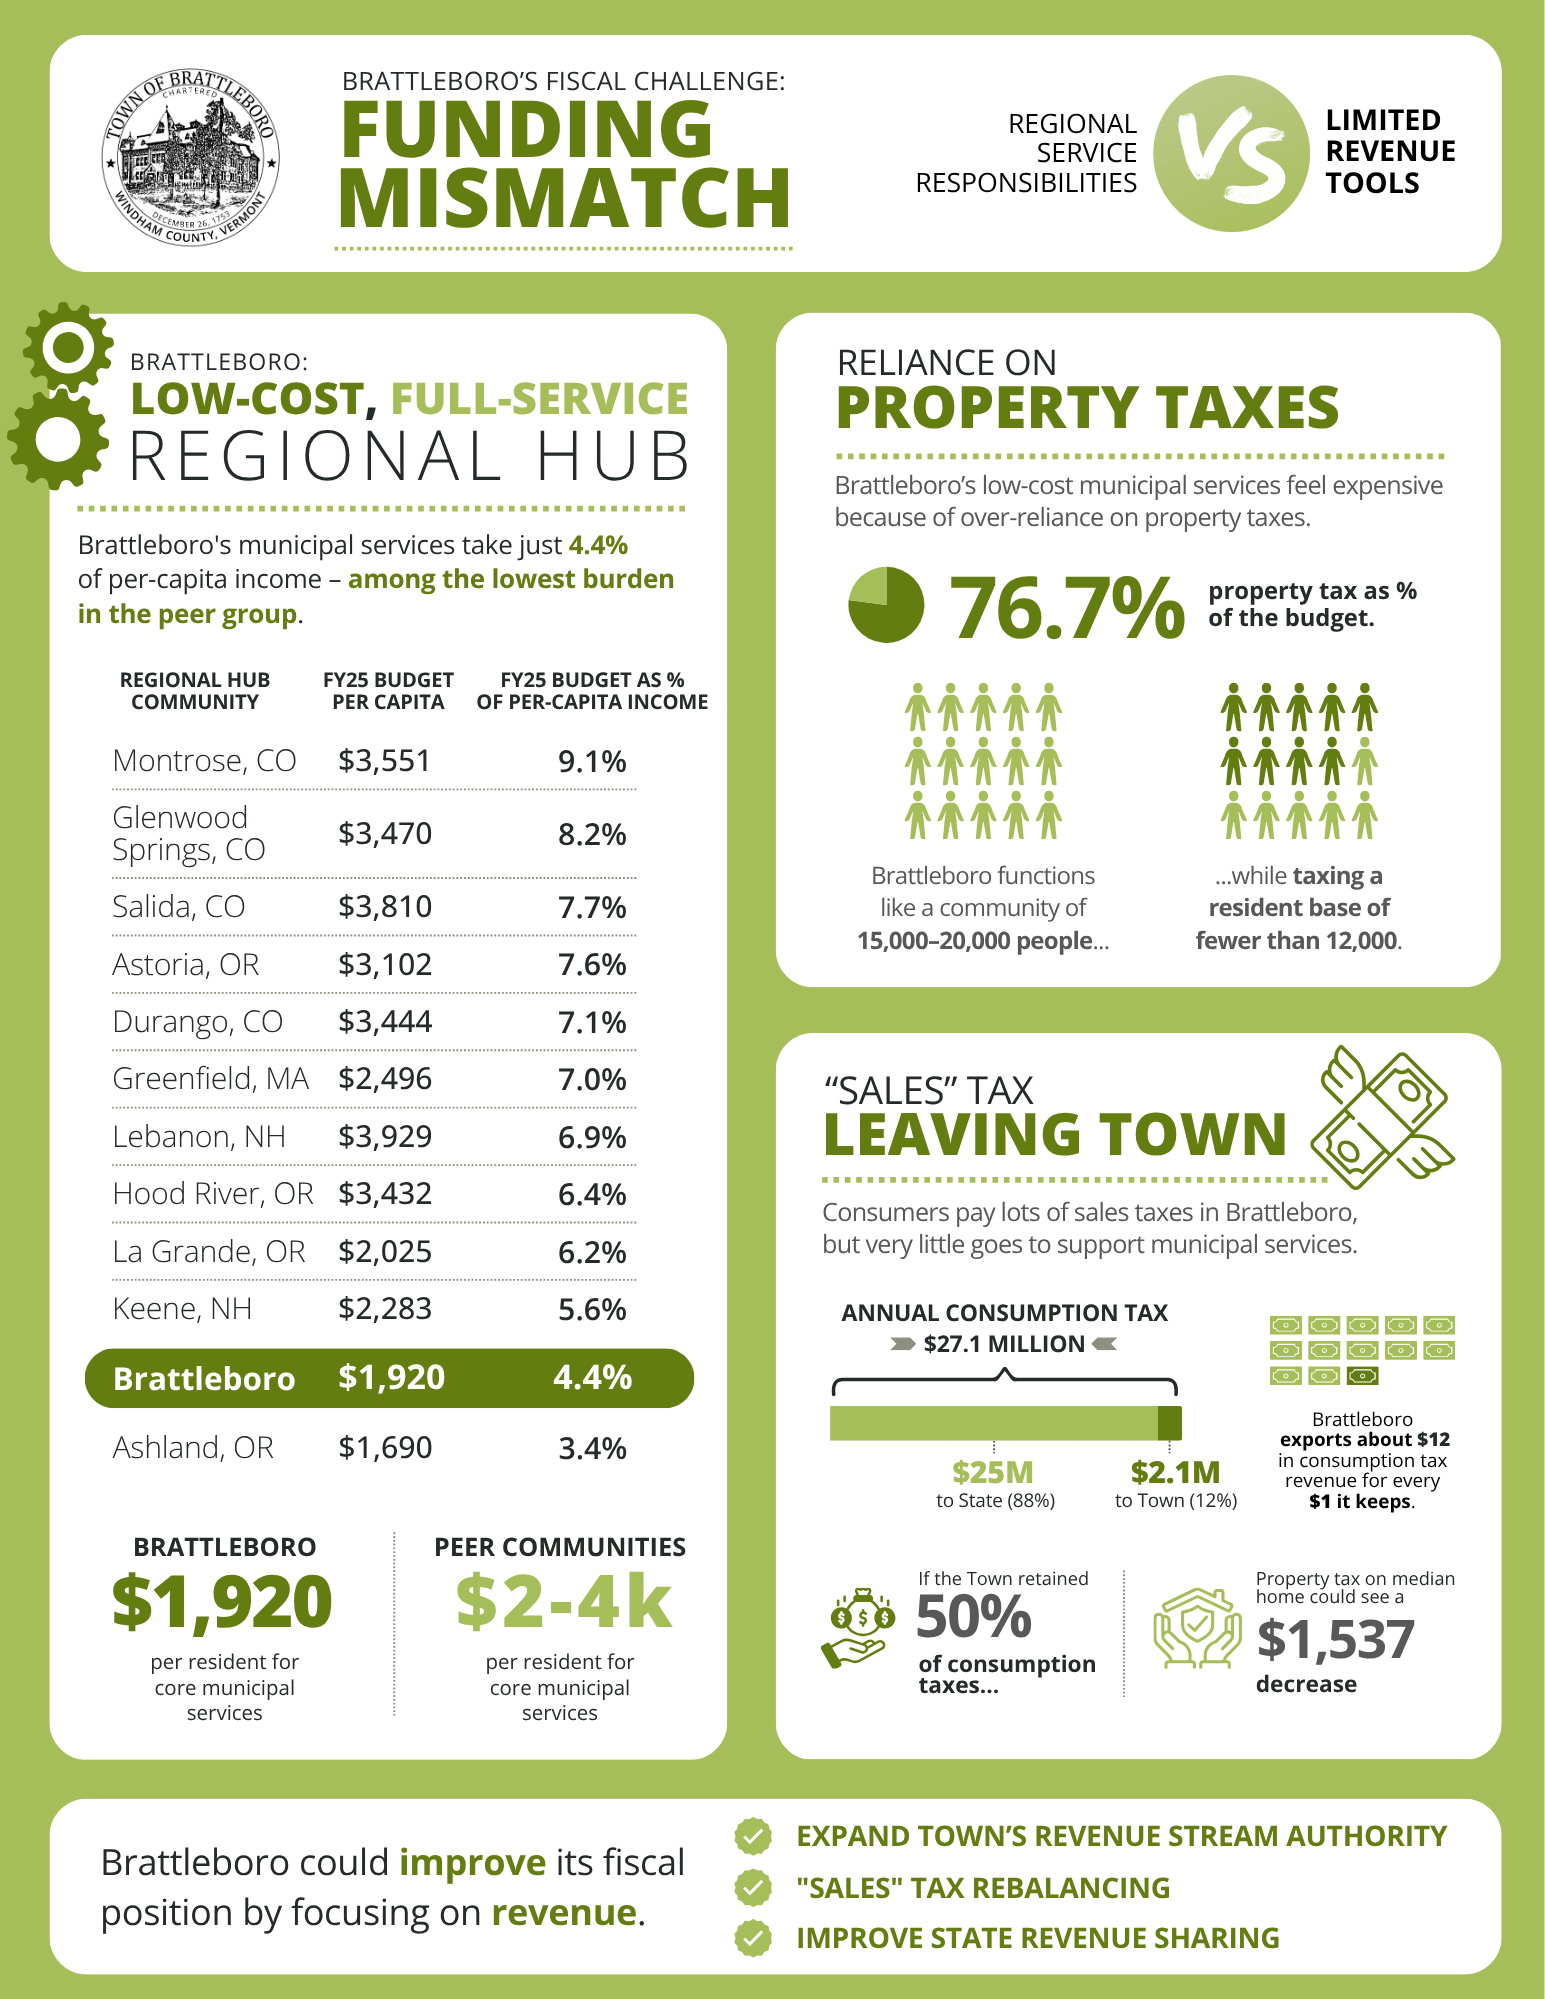
This benchmarking analysis shows that Brattleboro is not a high-spending municipality. In fact, Brattleboro provides a full suite of municipal services at one of the lowest per-capita costs among comparable regional hub communities across the country.
In FY25, Brattleboro spent approximately $1,920 per resident on core municipal services such as police, fire, public works, administration, library, and planning. Comparable regional hub towns typically spend between $2,000 and $4,000 per resident, even when they provide fewer services at the municipal level. When measured against local incomes, Brattleboro’s municipal services consume just 4.4% of per-capita income, among the lowest burdens in the peer group.
If spending is comparatively low, why does it feel so expensive? The answer lies in how the Town funds it services, not in how much they cost.
Property taxes pay for approximately 77% of Brattleboro’s General Fund expenditures, a much higher share than in comparable hub communities. Many peer towns fund less than half of their municipal services through property taxes and rely far more heavily on consumption-based taxes (such as sales, rooms and meals, fuel, and other user-based revenues) as well as more robust state revenue-sharing systems.
As a result, Brattleboro residents shoulder a disproportionate share of the cost for services that benefit a broader regional population including workers, visitors, students, and service users from surrounding towns. Brattleboro functions like a community of 15,000–20,000 people while taxing a resident base of fewer than 12,000.
The conclusion is straightforward:
Brattleboro’s fiscal challenge is not excessive spending. It is a structural mismatch between regional service responsibilities and limited revenue tools. Without greater access to diversified, (non-property-tax) revenue sources like those commonly available to regional hub communities in other states, Brattleboro will continue to experience significant property tax pressure even while operating efficiently and maintaining core municipal services.
Background
The purpose of this memo is to inform upcoming Selectboard discussions on budget sustainability, revenue policy, and legislative advocacy by clarifying how Brattleboro compares to peer regional hub communities and why property tax pressure is so high. It is ultimately a memo about how to pay for municipal services, not whether to provide them.
It started with the observation that other hub communities are paying for services differently than Brattleboro. Having worked in Oregon, Colorado, Massachusetts, and New York, I knew of other towns, like Brattleboro, that serve as regional hubs or “county seats” with urban-level services provided in small-town footprints. The ones I was familiar with are not experiencing as intense a property tax pressure as is often voiced in Brattleboro.
In Oregon, these are places like Astoria, LaGrande, Ashland, and Hood River. These towns are not only similar in population to Brattleboro but also play a structurally similar role as functional regional hubs, not just municipalities, where daytime and seasonal populations significantly exceed census numbers. These are towns that have built-up downtowns; support arts, culture, and recreation economies for a broader region; and have full municipal service responsibilities. The context differs, however, with respect to considerations like regional labor markets, home rule governance, less intense service demand, and the lack of meaningful winter weather costs.
Similarly in Colorado, towns like Durango, Glenwood Springs, Montrose, and Salida functionally compare to Brattleboro with regional hub roles, full municipal services, compact downtowns, and service demands beyond the residential base. Most of these towns also act as service centers for a large rural region. I selected these peer communities because they serve as regional hubs for surrounding rural areas, provide full municipal services, and are not suburbs of a metro area or an extremely wealthy or tourist-based town.
Back in the Northeast, some of the most analogous towns to Brattleboro are places like Keene, Lebanon, and Greenfield. These towns are regional service hubs with similar populations to Brattleboro. They serve surrounding rural areas and absorb daytime population from those areas, as well as from through-travelers. Thereby, they have a similar need to provide significant services for non-residents. All four of these towns run their own police and fire departments, maintain similar road systems, and operate a library and park facilities. They have dense, walkable downtowns with high pedestrian activity, events similar to First Friday/Gallery Walk, and a fair degree of nightlife. Keene has a larger commercial and retail base than Brattleboro.
Lebanon has different demands due to the influence of Dartmouth Health, and Greenfield due to the dense Massachusetts state and county service network. These factors somewhat skew the demand profile for municipal services, but all four local governments must maintain 24/7 readiness across core services with similar peak-time staffing needs, administrative complexity, and labor costs.
No two municipalities are identical. The purpose of this analysis is not to find perfect matches, but to identify consistent structural patterns across communities that perform a similar regional hub function. With twelve peer communities selected, I compared the cost of municipal services for each town and will try to explain how they differ and where Brattleboro sits in comparison.
Benchmarking the Cost of Municipal Services
Because the comps are from across the country in different states and with different histories around how municipal services are accounted for in various budgets, I had to “normalize” them as much as possible. The general fund municipal services that I tried to isolate were:
- EMS (if provided)
- Dispatch (if provided)
- Public Works (streets, fleet, facilities, engineering)
- Parks and Recreation (if provided)
- Library (if provided)
- Planning (zoning, code enforcement, building inspection)
- Solid Waste (if provided)
Excluded everywhere in the analysis were schools, enterprise funds (water, sewer, electric), and larger one-time capital projects. While some town budgets benefit from counties providing what Brattleboro provides as a municipal service, if a peer town delivers that service through a separate fund, I added that back in to show the full, comparable, municipal service cost. The analysis is based on available FY25 numbers to best present an apples-to-apples comparison. It included a line-item review of each budget which should be more than adequate for revealing the structural challenges and financial opportunities for Brattleboro.
The table below benchmarks the peer communities for per-capita operating costs for FY25. My confidence in these numbers is very good; however, some budget reports were better than others for isolating division-level costs (see Attachment B for references and Attachment C for the raw analysis data, in case anyone wants to see the underlying assumptions or replicate the findings). This table compares peer communities on a normalized, audit-level basis to the extent practical. For simplicity, “normalized operating cost” means the cost of core municipal services like police, fire, roads, rec and parks, library, clerk, and related services, excluding schools, utilities, and services that are not provided in Brattleboro, such as municipal court. Service-platform differences are explicitly noted to support comparison. Population numbers are from the U.S. Census Bureau as of July 1, 2024 (https://www.census.gov/quickfacts/). Communities are ranked by their descending cost per capita.
| Community | Population (2024) | “Normalized” Operating Cost (FY25) | Cost per Capita | Municipal Platform |
|---|---|---|---|---|
|
Lebanon |
15,389 | $60.5M | $3,929 | Full |
| Salida | 6,007 | $22.9M | $3,810 | Partial |
| Montrose | 21,646 | $76.9M | $3,551 | Partial |
| Glenwood Springs | 10,311 | $35.8M | $3,470 | Partial |
| Durango | 19,811 | $68.2M | $3,444 | Full |
| Hood River | 8,350 | $28.7M | $3,432 | Partial |
| Astoria | 9,906 | $30.7M | $3,102 | Full |
| Greenfield | 17,633 | $44.0M | $2,496 | Full |
| Keene | 23,034 | $52.6M | $2,283 | Partial |
| La Grande | 13,058 | $26.4M | $2,025 | Full |
| Brattleboro | 11,975 | $23.0M | $1,920 | Full |
| Ashland | 20,935 | $35.4M | $1,690 | Partial |
Table Notes: “normalized operating costs” include General Fund and other governmental operating funds supporting core municipal services. Capital expenditures and enterprise utilities are excluded unless they directly support municipal operations and are comparable to capital improvements in Brattleboro. “Full” municipal platform indicates that the municipality operates police, Fire/EMS, public works, and administration, as well as municipal dispatch, solid waste collection, and library services. “Partial” platform indicates one or more of those services are provided by county, regional, private, or special-district entities, and therefore do not appear in municipal operating costs. Because several peer communities externalize dispatch, library, and solid waste services, their per-capita municipal costs understate the full local public-service footprint relative to fullplatform communities like Brattleboro.
What this table shows is that Brattleboro is the lowest-cost full-service municipality in the peer group. In fact, Brattleboro’s overall cost for services competes well against many communities that do not provide 911 dispatch services, a library, or solid waste collection in their municipal budget. Because Brattleboro already operates at the low end of the cost spectrum, further reductions would likely require the elimination or degradation of core services rather than efficiency gains.
The next question that I had was how the cost of municipal services compare across these municipalities from the standpoint of annual per capita income. In other words, is spending on municipal services in Brattleboro taking a higher proportion of annual per capita income than other peer communities?
The following table compares service costs to income. Annual per capita incomes are from the U.S. Census Bureau (https://www.census.gov/quickfacts/) and are given in 2024 dollars. The table is ranked in descending order of percent cost of municipal expenditures per annual per-capita income.
| Community | Per-Capita 2024 Income ($) | Municipal Cost Per-Capita ($) | Expenditures as % of Per-Capita Income | Municipal Platform |
|---|---|---|---|---|
| Montrose | 39,045 | 3,551 | 9.1% | Partial |
| Glenwood Springs | 42,207 | 3,470 | 8.2% | Partial |
| Salida | 49,277 | 3,810 | 7.7% | Partial |
| Astoria | 40,705 | 3,102 | 7.6% | Full |
| Durango | 48,642 | 3,444 | 7.1% | Full |
| Greenfield | 35,425 | 2,496 | 7.0% | Full |
| Lebanon | 56,599 | 3,929 | 6.9% | Full |
| Hood River | 53,674 | 3,432 | 6.4% | Partial |
| La Grande | 32,892 | 2,025 | 6.2% | Full |
| Keene | 40,992 | 2,283 | 5.6% | Partial |
| Brattleboro | 43,444 | 1,920 | 4.4% | Full |
| Ashland | 50,414 | 1,690 | 3.4% | Partial |
In Astoria, the annual per-capita income is $40,705, a “poorer” community than Brattleboro, yet 7.6% of people’s annual income goes to municipal services, while it only costs 4.4% of annual income for a similar suite of services in Brattleboro. The burden on incomes is even higher in Montrose and Glenwood Springs, which are also both “poorer” per-capita than Brattleboro; and those communities rely on county-level services that Brattleboro pays for itself.
This analysis anchors the comparison in household capacity first and then shows what the municipal government costs. It is clear that Brattleboro’s costs are low not only absolutely but also relative to income. When municipal costs are measured relative to local income and scope of services, Brattleboro ranks among the lowest-burden, full-service communities in the peer group.
So, if Brattleboro is low-cost compared to peers, why does the tax burden feel so high?
Benchmarking Municipal Property Tax Revenues
In completing the analysis of comparable peer communities, I took note of the revenue profile in each municipal budget focusing on the amount that the towns rely on property taxes. Not every town used property taxes as a revenue source, but most had it as a component of how they pay for municipal services. The variation is explained largely by the level of authority at the municipal level to diversify its revenue streams.
The next table benchmarks property tax revenues across the twelve peer communities. It shows the property tax as a percentage of expenditures for the municipal General Fund profile like Brattleboro’s. It also analyzes the property tax as a percentage of annual per-capita income.
| Community | Property Tax as % of Expenditures | Property Tax Per-Capita ($) | Property Tax as % of Per-Capita Income |
|---|---|---|---|
| Greenfield | 88.0% | 2,196 | 6.2% |
| Brattleboro | 76.7% | 1,472 | 3.4% |
| Keene | 56.7% | 1,294 | 3.2% |
| Lebanon | 53.6% | 2,104 | 3.7% |
| Ashland | 31.6% | 535 | 1.1% |
| Astoria | 28.3% | 877 | 2.2% |
| La Grande | 24.0% | 486 | 1.5% |
| Hood River | 12.6% | 432 | 0.8% |
| Glenwood Springs | 8.2% | 283 | 0.7% |
| Durango | 5.6% | 193 | 0.4% |
| Salida | 0.0% | 0 | 0.0% |
| Montrose | 0.0% | 0 | 0.0% |
This table shows that Brattleboro is an extreme outlier, along with Greenfield, in its reliance on property taxes, despite having among the lowest overall service costs in the peer group. Brattleboro funds over three-quarters of its municipal services through property tax which is well above its peers, especially those in the western United States. In Oregon and Colorado, property taxes typically fund under one-third of municipal services and, quite often, under 10%. This remains true even in communities where total spending is higher, and staffing levels are more intensive.
Other communities are paying for municipal services by relying more heavily on alternative sources like consumption taxes, motor vehicle fees, franchise fees, statewide equalization funding, and even in some cases a local income tax. Brattleboro has a limited revenue authority from the State of Vermont, and that restricts its ability to reduce the property tax pressure on property owners who may feel an affordability pinch due to limited or fixed incomes*.
* Vermont does have the homestead exemption, but the State decides how much and when to deploy that, without municipal coordination.
Property taxes are paid primarily by residents and property owners. However, municipal services, be they roads or public safety responses or removal of solid waste, are used by a much broader population than just residents in hub communities. Factors driving the pressure on resident affordability include daytime populations, regional provision of services, tourism and event economies, and cross-border draws. When workers, students, tourists, and service users come to a hub community, they may benefit from municipal services but make limited contributions towards paying for them. Brattleboro functions like a 15,000 to 20,000 person community while taxing a base of under 12,000 residents. When property taxes carry most of the burden, residents effectively subsidize services used by many non-residents.
This is the reason why many western United States hub communities have increasingly relied on consumption taxes such as sales, rooms and meals, alcohol, and fuel taxes instead of property taxes. The municipal services are covered more fairly by all the users, with those consuming more resources in the community paying more of the costs of road maintenance, emergency services, and the like.
Consumption Taxes in Brattleboro
Each year, Brattleboro generates approximately $25 million in consumption taxes that go to the State of Vermont. The Town retains about $2 million locally in the “local option” portion of the consumption taxes. The remainder supports state programs rather than offsetting local property taxes.
The Town benefits from a 0.75% sales tax and rooms and meals tax, that is often referred to as the “1% local option tax.” This generated $1.6 million in FY25 revenues, somewhat offsetting the Town’s reliance on property taxes. However, the local option tax is layered on top of significant state consumption taxes. The general sales tax in Brattleboro is 7% on most retail sales of goods and services, but about 89% of that sales tax revenue generated locally in Brattleboro goes to the State instead of being captured in town to offset the property taxes, like it does in many of the peer communities studied.
The following summary table explains the allocation rate of consumption taxes in Brattleboro with those retained locally versus those exported from the community:
| Type of Tax | Total Tax Rate | Local Share | State Share |
|---|---|---|---|
| Sales | 7% | 0.75% | 6.25% |
| Meals | 10% | 0.75% | 9.25% |
| Rooms | 10% | 0.75% | 9.25% |
| Alcohol | 11% | 0.75% | 10.25% |
| Fuel | Varies | 0% | 100% |
Given this rate structure, although Brattleboro hosts significant regional and visitor spending, it keeps only 9% overall of the total consumption taxes charged locally. Conservatively estimated, Brattleboro is generating on the order of $25 million annually in State-exported consumption taxes (2025), while retaining only $2.1 million locally. This means for every $1.00 the Town keeps to offset the property tax, roughly $12 leaves the community. The following table, based on the most recent returns, estimates the taxable base and the total amount of consumption taxes by recipient.
| Tax Type | Est. Annual Taxable Base ($) | Annual Consumption Taxes to Town ($) | Annual Consumption Taxes to State ($) |
|---|---|---|---|
| Sales | 201 million | 1.5 million | 13.0 million |
| Meals and Rooms | 63 million | 0.45 million | 6.0 million |
| Alcohol | 19 million | 0.15 million | 2.0 million |
| Fuel | (14 million gal.) | — | 4.0 million |
| Total | — | 2.1 million | 25.0 million |
Table Notes: assume alcohol sales comprise 24% of meals and rooms returns. Assume 1.5 million gallons of gas on average are sold annually at each of the nine gas stations in Brattleboro. Further analysis could estimate State taxes currently transferred from Brattleboro for heating oil, propane, kerosene, diesel, natural gas, coal, and electricity. These were not included in this analysis. Of the $3 million collected for the 1% local option tax, only $2.1 million are paid to the Town (see 2/5/2026 Local Option Disbursement Report in Town files).
Vermont’s tax structure is uniquely restrictive for hub towns. In the peer communities studied, there are different ways that municipalities have been able to keep their property taxes down. In some states, towns benefit from much more generous revenue-sharing from the state. Other states allow municipalities to recover motor vehicle registration fees, electricity distribution fees, and other similar revenues. Finally, in some states, municipalities retain a much higher share of local sales tax and rooms and meals taxes that are generated locally. In Colorado, for example, the average sales tax retained by peer towns was 41% of the total, compared to Brattleboro’s 11%. In Vermont, the State retains both the base tax and a significant percentage of the local option tax without compensating hub towns through a municipal revenue-sharing formula, as the Brattleboro Selectboard has been pursuing.
| Peer Town | Sales Tax Charged | Percent Retained by Municipality | Percent Going to the State |
|---|---|---|---|
| Salida | 8.7% | 3.0% | 2.9% |
| Durango | 9.4% | 3.5% | 2.9% |
| Montrose | 8.5% | 3.9% | 2.9% |
| Glenwood Springs | 9.4% | 4.2% | 2.9% |
| Brattleboro | 7.0% | 0.8% | 6.3% |
In Oregon, municipal governments are significantly funded by state-shared revenues coming from sources such as gasoline taxes, liquor taxes, vehicle registration fees, cigarette and marijuana taxes, and lottery funding. They also have the authority to derive revenues from franchise fees on utilities such as electric, cable, and solid waste.
If the overall consumption tax split for Brattleboro were to rebalance more in favor of the local municipality, there could be a profound impact to the property taxes assessed. The following table looks at the local property tax impact of various changes to State consumption tax policy based on shifts of the proportion rather than on any new tax increases. These scenarios are illustrative only and assume no change in overall tax rates or service levels. They demonstrate the scale of potential property tax relief associated with revenue rebalancing, not a recommendation for specific tax policy changes.
| State % Retained | Town % Retained | Town Revenues | Propety Tax % of Total Expenditures | Property Tax Decrease (Median Home) |
|---|---|---|---|---|
| 89% (current) | 11% | $3 million | 76.7% | — |
| 80% | 20% | $6 million | 63.6% | $659 |
| 75% | 25% | $7 million | 59.3% | $769 |
| 50% | 50% | $14 million | 28.8% | $1,537 |
Table Note: property tax percentage based on FY25 budget. Assume ~$6.10 reduction in property taxes per $100,000 assessed value for every $100,000 of additional non-property tax revenues (based on FY27 budget analysis and no change to the Grand List) and assume median home in Brattleboro is assessed at $180,000.
Brattleboro generates substantial consumption-tax revenue on behalf of the State but retains only a small fraction locally. As a result, residents fund services used by a much larger population of workers, visitors, students and regional service users without a fair contribution from those users. If Brattleboro funded municipal services at the peer median property-tax share (approximately 30-40%), the Town’s current General Fund would require $8-10 million less in annual property tax revenue, with the difference made up through non-property tax sources commonly available to hub communities elsewhere.
Conclusion
This benchmarking analysis selected eleven other towns that compare well to Brattleboro for their population scale, direct municipal full-service responsibilities, regional hub function, geographical isolation from large urban centers, and downtown-centered service delivery. It then compared these communities' costs for municipal services and their revenue make-up. The peer analysis used publicly adopted municipal operating budgets, applied consistent inclusion and exclusion rules across states, and relied on conservative assumptions that tend to understate Brattleboro’s service load. When differences exist, they generally bias the comparison against Brattleboro rather than in its favor due to the lack of county-level services in Vermont. For these reasons, I am confident that the conclusions are directionally sound and defensible. Brattleboro’s fiscal challenge is not excessive municipal spending. It is the mismatch between the services that a regional hub community must provide, and the limited revenue tools available under Vermont law.
Brattleboro is an outlier in property-tax dependence, not in spending. The Town is a low-spending municipality overall with a cost per capita of $1,920 while many peer communities cluster in the $3,000 to $3,900 range. However, Brattleboro funds its services very differently. With 77% of expenditures from property taxes, only Greenfield is higher (88%). Many western peers are below 15%, with several at or near zero. Although Brattleboro’s total municipal spending is modest relative to income, the concentration of that load on the property tax makes the impact more visible and more acute for homeowners and landlords. Brattleboro’s challenge is not how much it spends, but how narrowly and regressively it is forced to raise revenue compared to peers.
Brattleboro could improve its fiscal position by focusing on revenue enhancements, as the Selectboard has been advocating. These could include an expanded local option sales tax authority or increased retention and rebalancing of local option revenue streams. A local option gasoline tax, as proposed by Representative Burke (H.766), or other transportation-related revenue streams, would be a significant help to fund local services and capital improvements while reducing the overall property tax load.
The benchmarking data shows that Brattleboro operates efficiently relative to peer regional hubs. The Town’s challenge is not excessive spending but a revenue structure that relies more heavily on property taxes than comparable communities. Without diversification of revenue sources or improved state revenue sharing, property tax pressure will continue even if spending remains contained. The policy question facing the Selectboard is not whether to provide core municipal services, but how to fund them fairly and sustainably in a regional hub context.